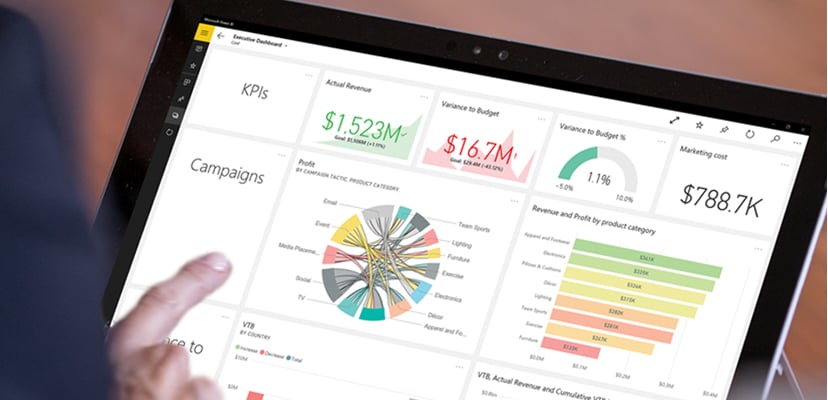
Data is a popular topic these days. OK, it has been since the days of the mainframe. We just have more of it now. With so much data being collected across so many locations, a tool like Power BI lets us connect to that data. Power BI enables us to present data visually, and provide intuitive details, insights and modeling examples in a familiar Microsoft Office experience.
Power BI On-Demand Training Option  Using Power BI provides end-users, not just database administrators with the ability to analyze data and create reports in an easy way that can turn a spreadsheet analyst into a data scientist with artistic flair! Many organizations we work with are now combining Power BI with Microsoft Teams. The growing popularity of Teams, used as a hub for our work and communications, lets us view live Power BI reports in Team tabs, pivoting on data views seamlessly, all while communicating around the reportable information. This is a great example of a new modern way to work around the nucleus, our data and content, while we communicate about it.
KnowledgeWave is excited to be offering a Power BI training series, Dancing with Data. This Power BI series starts at the fundamentals and moves to more advanced topics to help the new to Power BI user gain skills quickly. This series of three 1-day classes will empower those that attend with all the skills needed to start working and visualizing data and creating consumable modifiable reports with Power BI Desktop. This course is available as a private training session.
Course: Dancing with Data
Duration: 3 X 1-day sessions
Dates: TBD
Times: TBD
Register and Pricing Info: Call (800) 831-8449
Power BI On-Demand Training Option
Dancing with Data: Power BI Desktop Fundamentals
This 1-day fundamentals course provides you with a jump start to Power BI Desktop. You will learn how to work with this powerful data visualization tool. Data visualization allows you to see insight into our data that would not be visible by just looking at the numbers – it will enable you to see trends and patterns for better decision making.
Topics:
- Installing the Power BI Desktop application
- Connecting to a data source
- Creating data visuals
- Applying data filters
- Building Dashboards
Dancing with Data: Power BI Desktop Intermediate
This Power BI Desktop Intermediate course provides instruction on using the Power Query Editor. The Power Query editor uses the M language to extract, transform, and load data for use in the Power BI Desktop. Perfect data doesn’t always exist to support your data visualizations. The Power Query editor allows you to shape data from various sources to power your data visualizations.
Topics:
- Connecting to a variety of data sources
- Managing rows and columns
- Transforming text, numerical, and data columns
- Adding new columns
- Performing data cleanup
- Applying filters
Dancing with Data: Power BI Desktop Advanced
The last class in this series, Power BI Desktop Advanced continues instruction on using the Power Query Editor from the Intermediate course. Data can come from various sources and is often fragmented. The Power Editor allows you to pull data from numerous data sources to produce a unified data set to perform data analysis. Data sources can be merged and stacked together.
Topics:
- Merging data
- Stacking data for simple data sources
- Stacking data for complex data sources
- Creating the classic “other” column development strategies – static and dynamic
- Exploring the M language
Please note that each class is a continuation of the preceding session. All three sessions should be attended. This series is currently be offered as a live online hands-on instructor-led class. This class can be attended from any location that has a good internet connection. Seating is limited to 10 participants on a first-come-first-serve basis. This course is available as a private session as well. Private training can be conducted in three consecutive days, or on any format that works best for your organization. This three-part class is taught at the university level in a semester format.